
David G. Simmons
Friday, August 23, 2019
Hiding Complexity with Custom Functions Calculating Heat Index
Have you ever watched the local weather — or The Weather Channel — and heard them announce the temperature, and then the “Heat Index”? Or how hot it feels outside? At least here in the United States, and especially in the South, it’s part of every weather broadcast in the summer. But have you ever wondered how they actually calculate the Heat Index? Since I collect temperature and humidity data, I decided one day I’d go and figure it out. After all, how hard could it be really? Hint: never ask yourself that question!
The Heat Index calculation
As soon as I went looking for what I was sure was a simple calculation to convert a temperature and a humidity reading into a heat index (HI) I was sorry I’d headed down this road. I easily found a page where the National Oceanic and Atmospheric Administration (NOAA) lays out the formula. It’s something called the Rothfusz Regression equation, and it goes like this:
HI = -42.379 + 2.04901523T + 10.14333127RH - .22475541TRH - .00683783TT - .05481717RHRH + .00122874TTRH + .00085282TRHRH - .00000199TTRHRH
Where T is temperature and RH is relative humidity. Simple, right? Not so fast! It turns out there are a bunch of caveats to that (simple) equation. For instance, if the relative humidity is less than 13% and the temperature is between 80ºF and 112ºF, then you have to adjust the heat index by subtracting the following Adjustment from it:
*ADJUSTMENT = [(13-RH)/4]SQRT{[17-ABS(T-95.)]/17}
Ok, fine. But wait, there’s more! If the relative humidity is above 85%, and the temperature is between 80ºF and 112ºF, then you need to add the following Adjustment to it:
ADJUSTMENT = [(RH-85)/10] / [(87-T)/5]
Outstanding! We’re finally there … wait, no we’re not there yet. If the heat index is below 80ºF, then you don’t need to use that calculation to determine the heat index. You can use a more simple Steadman equation:
HI = 0.5 / {T + 61.0 + [(T-68.0)1.2] + (RH0.094)}
So first you calculate the heat index using that ‘simple’ equation – and, according to NOAA, you average that with the temperature reading. If that is less than 80ºF, you have your answer. If not, you need to proceed with the Rothfusz regression and add (or subtract) any adjustments, if required.
See? Simple, really.
Doing it in Flux
Here’s where some complicated Flux comes into play. You see, my temperature and humidity readings are in different measurements, so first there’s the task of building the tables, and joining them (yay for the beauty of cross-measurement math in Flux!).
humidity = from(bucket: "telegraf")
  |> range(start: v.timeRangeStart, stop: v.timeRangeStop)
  |> filter(fn: (r) => r._measurement == "environment" and (r._field == "humidity"))
  |> aggregateWindow(every: 30s, fn: mean)
  |> fill(column: "_value", usePrevious: true)
  |> keep(columns: ["_value", "_time"])

temperature = from(bucket: "telegraf")
  |> range(start: v.timeRangeStart)
  |> filter(fn: (r) => r._measurement == "temperature" and (r._field == "temp_f"))
  |> aggregateWindow(every: 30s, fn: mean)
  |> fill(column: "_value", usePrevious: true)
  |> keep(columns: ["_value", "_time"])
  |> yield(name: "Temperature")
That gets me my 2 tables of values. (Side note: I yield the Temperature table so that my graph will show both the temperature and the heat index on the same graph.)
Next, I join the 2 tables:
first_join = join(tables: {temperature: temperature, humidity: humidity}, on: ["_time"])
  |>map(fn: (r) => ({temperature: r._value_temperature, humidity:r._value_humidity, _time: r._time}))
  |> keep(columns: ["_time", "humidity", "temperature"])
So now I have a single table, aligned on time, with columns for temperature and humidity. All that’s left is to do the calculation:
|> map(fn: (r) => ({t: r.temperature, h: r.humidity}))
  |> map(fn: (r) => ({
     r with heatIndex:
       if ((0.5 * (r.t + 61.0 + ((r.t-68.0)*1.2) + (r.h*0.094)))/2.0) < 80.0 then (0.5 * (r.t + 61.0 + ((r.t - 68.0)*1.2) + (r.h*0.094)))
       else if ( r.h < 13.0 and r.t > 80.0) then ((-42.379 + 2.04901523*r.t + 10.14333127*r.h - .22475541*r.t*r.h - .00683783*r.t*r.h - .05481717*r.t*r.h + .00122874*r.t*r.t*r.h + .00085282*r.t*r.h*r.h - .00000199*r.t*r.t*r.h*r.h - (((13.0-r.h)/4.0)*math.sqrt(x: ((17.0-math.abs(x: (r.t-95.0))/17.0))))))
        else if r.h > 85.0 and r.t >= 80.0 and r.t <= 87.0 then ((-42.379 + 2.04901523*r.t + 10.14333127*r.h - .22475541*r.t*r.h - .00683783*r.t*r.h - .05481717*r.t*r.h + .00122874*r.t*r.t*r.h + .00085282*r.t*r.h*r.h - .00000199*r.t*r.t*r.h*r.h) + (( r.h-85.0 )/10.0) *((87.0-r.t)/5.0))
        else (-42.379 + 2.04901523*r.t + 10.14333127*r.h - .22475541*r.t*r.h - .00683783*r.t*r.h - .05481717*r.t*r.h + .00122874*r.t*r.t*r.h + .00085282*r.t*r.h*r.h - .00000199*r.t*r.t*r.h*r.h)
      })
  )
  |> map(fn: (r) => ({_value: r.heatIndex, _time: r._time}))
  |> yield(name: "HeatIndex")
I told you it was complicated Flux!
But in the end, you can then have a graph that shows the actual temperature and the calculated Heat Index in the same table cell:
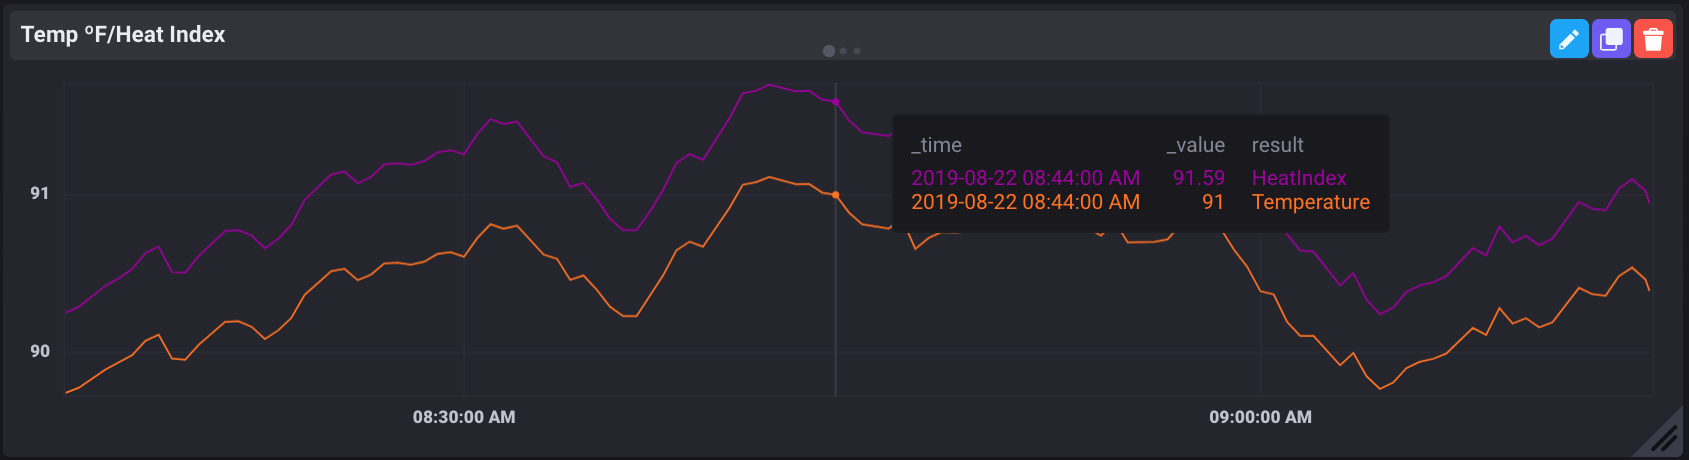 And that’s a pretty cool thing!
Next step
Since that’s a lot of complicated Flux. The next step is to pull that all into Flux functions so that you can simply call |> HeatIndex() on your table with temperature and humidity columns and get back the proper table with the resulting heat indexes all calculated for you. So I’m in the process of adding the HeatIndex() function to Flux so you can have pretty Flux when you calculate your heat indexes.
I’m planning to add in the calculation for Ideal Gas Law (an easy one) and Wind Chill as well (another ugly one!) to this future package as well as converters from ºF to ºC, so if you have any other ideas for things that you would use for environmental calculations, please reach out and let me know!