
David G. Simmons
Friday, June 23, 2017
You Haven't Seen Big Data Yet
Yeah, I know, “Big Data” as a buzz-word is so 5 minutes ago. The tech world is chronically ADD and prone to being distracted by the next shiny object (OOh! Look, IoT!, Wait, AI! SQUIRREL!!) But stay with me on this. It’s all connected. I’ve been saying since at least 2005 (back when Big Data was all the rage) that you haven’t seen truly big data until the IoT truly gets going in full force. Social media is pretty prolific – an average of 6,000 tweets per second, or half a billion tweets per day. That’s a lot of data. But it’s peanuts. Let’s say you have an industrial IoT deployment monitoring 1,000 machines. Each machine is providing telemetry on 7 or 8 parameters. It’s logging that telemetry 2 - 3 times per second. That’s 16,000 per second. From ONE factory. Now lets say you have 10 factories worldwide. 160,000 per second. Try to keep up. No, really, just try.
Here’s my IoT Rule, again: Anything that’s based on the number of people on the planet is upper-bounds limited. When I first said this back in 2004 Sun (a moment of silence, please) had licensed Java on 1 billion cell phones. Even if every human carried 4 cell phones, that would have only been 24 billion devices (population at the time was one;y 6 billion). A limited market.
IoT is not based on the number of people on the planet, but on the number of things and hence is not necessarily upper-bounded. Think about that – no upper bounds – as it applies to the devices and hence the data-stream. Now the promise of IoT systems is to provide realtime, actionable data. And really, why would you go to the time and expense of deploying an IoT system if you weren’t going to do something with the torrent of data it will provide. Even better than just providing actionable data is providing real-time actionable intelligence.
The problem is, clearly, how do you actually do any sort of reasonable data analysis on 160,000 datapoints per second? That’s 9.6 million per minute. That’s half a billion per hour. So that’s the entire Twitter feed per day every hour. Every. Hour.
Right now, this is not something that most people in the IoT world are addressing, or even talking about. Why? Because, obviously, they don’t have a solution for it. Look! SQUIRREL! We just won’t talk about that.
But I stumbled onto something. Something really pretty amazing. Something that actually solves this problem in the most elegant way. What if you could effortlessly query and visualize a dataset of billions of rows of data? In real time. It’s called MapD. It’s a database that runs on GPUs, not CPUs (though you can run it on CPUs if you want slower performance). GPUs do really really well at parallelizing data processing, and of course graphics.
So let’s just look at one of their demos. It’s the ship movements in the US between 2009 and 2015. All of them. Every.Single.One. Over 11 billion records of geospatial data.
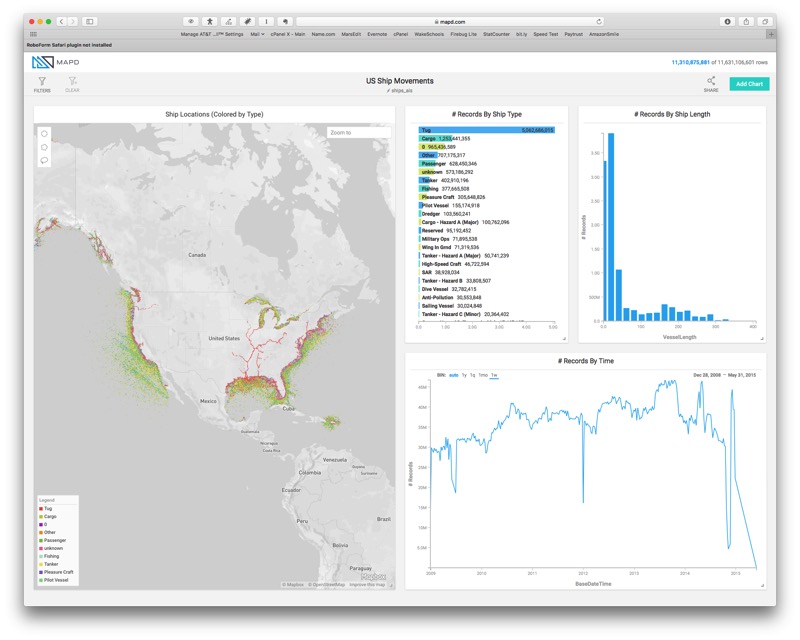
That’s a still shot, but if you go play with the demo you’ll find that you can drill down through the data. Way down into the data. My best friend is a tugboat captain. He’s been working on the new Tapanzee Bridge for the last 5 years. So I decided to see what I could see about what was going on there.
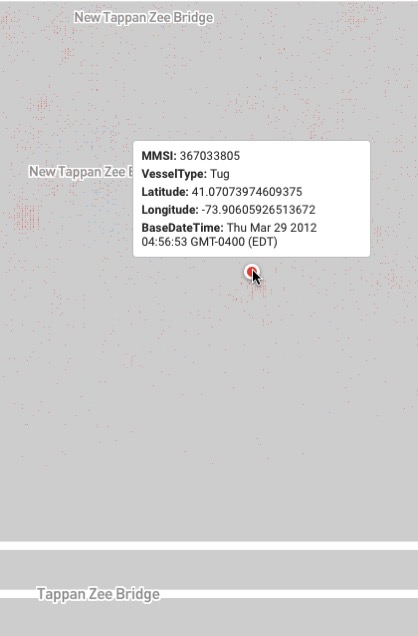
I found his tugboat. I also found his tugboat, and the law-enforcement boats, the night someone jumped off the bridge and they all raced to find them. And it’s a seamless, fluid, immersive experience.
Absolutely incredible! Now, if they can do that with 11 billion geospatial records of ships, well, then that’s not too far off from a days worth of data in my examples above. That allows you to actually visualize your incoming data in real time, and make it actionable. That makes the IoT actually practical and useful. Finally!