


David G. Simmons
January 2, 2017
My Winter Vacation (what I did with IoT and ARTIK-5)
I don’t know about you, or what you did with your winter vacation (or if you even got one, and if you didn’t, I’m sorry) but one of the fun things I did with mine was to spend a little time with my Samsung ARTIK Dev Kit. If you read the Hardware Extravaganza Post, you’ll know that I got an ARTIK-0 and an ARTIK-5 developer kit not long ago. I’ve been up to my ears in MyNewt though and haven’t had time to do much with them, sadly. That is, until my winter break came along.
I didn’t want to spend the whole time playing in my office and annoy my family, so I decided to just try a quick project using some existing sensor hardware I have lying around. (Note: I have a vast amount of sensor hardware “just lying around”) I decided to try using the eTape Liquid Level Sensor that I’ve already been playing with for the MyNewt project. It’s a fairly simple Analog sensor for reading the water/liquid level in a container. Or, in my case, on my back patio which regularly floods! I also decided to pull out the ARTIK-5 first since it’s extremely easy to get going.
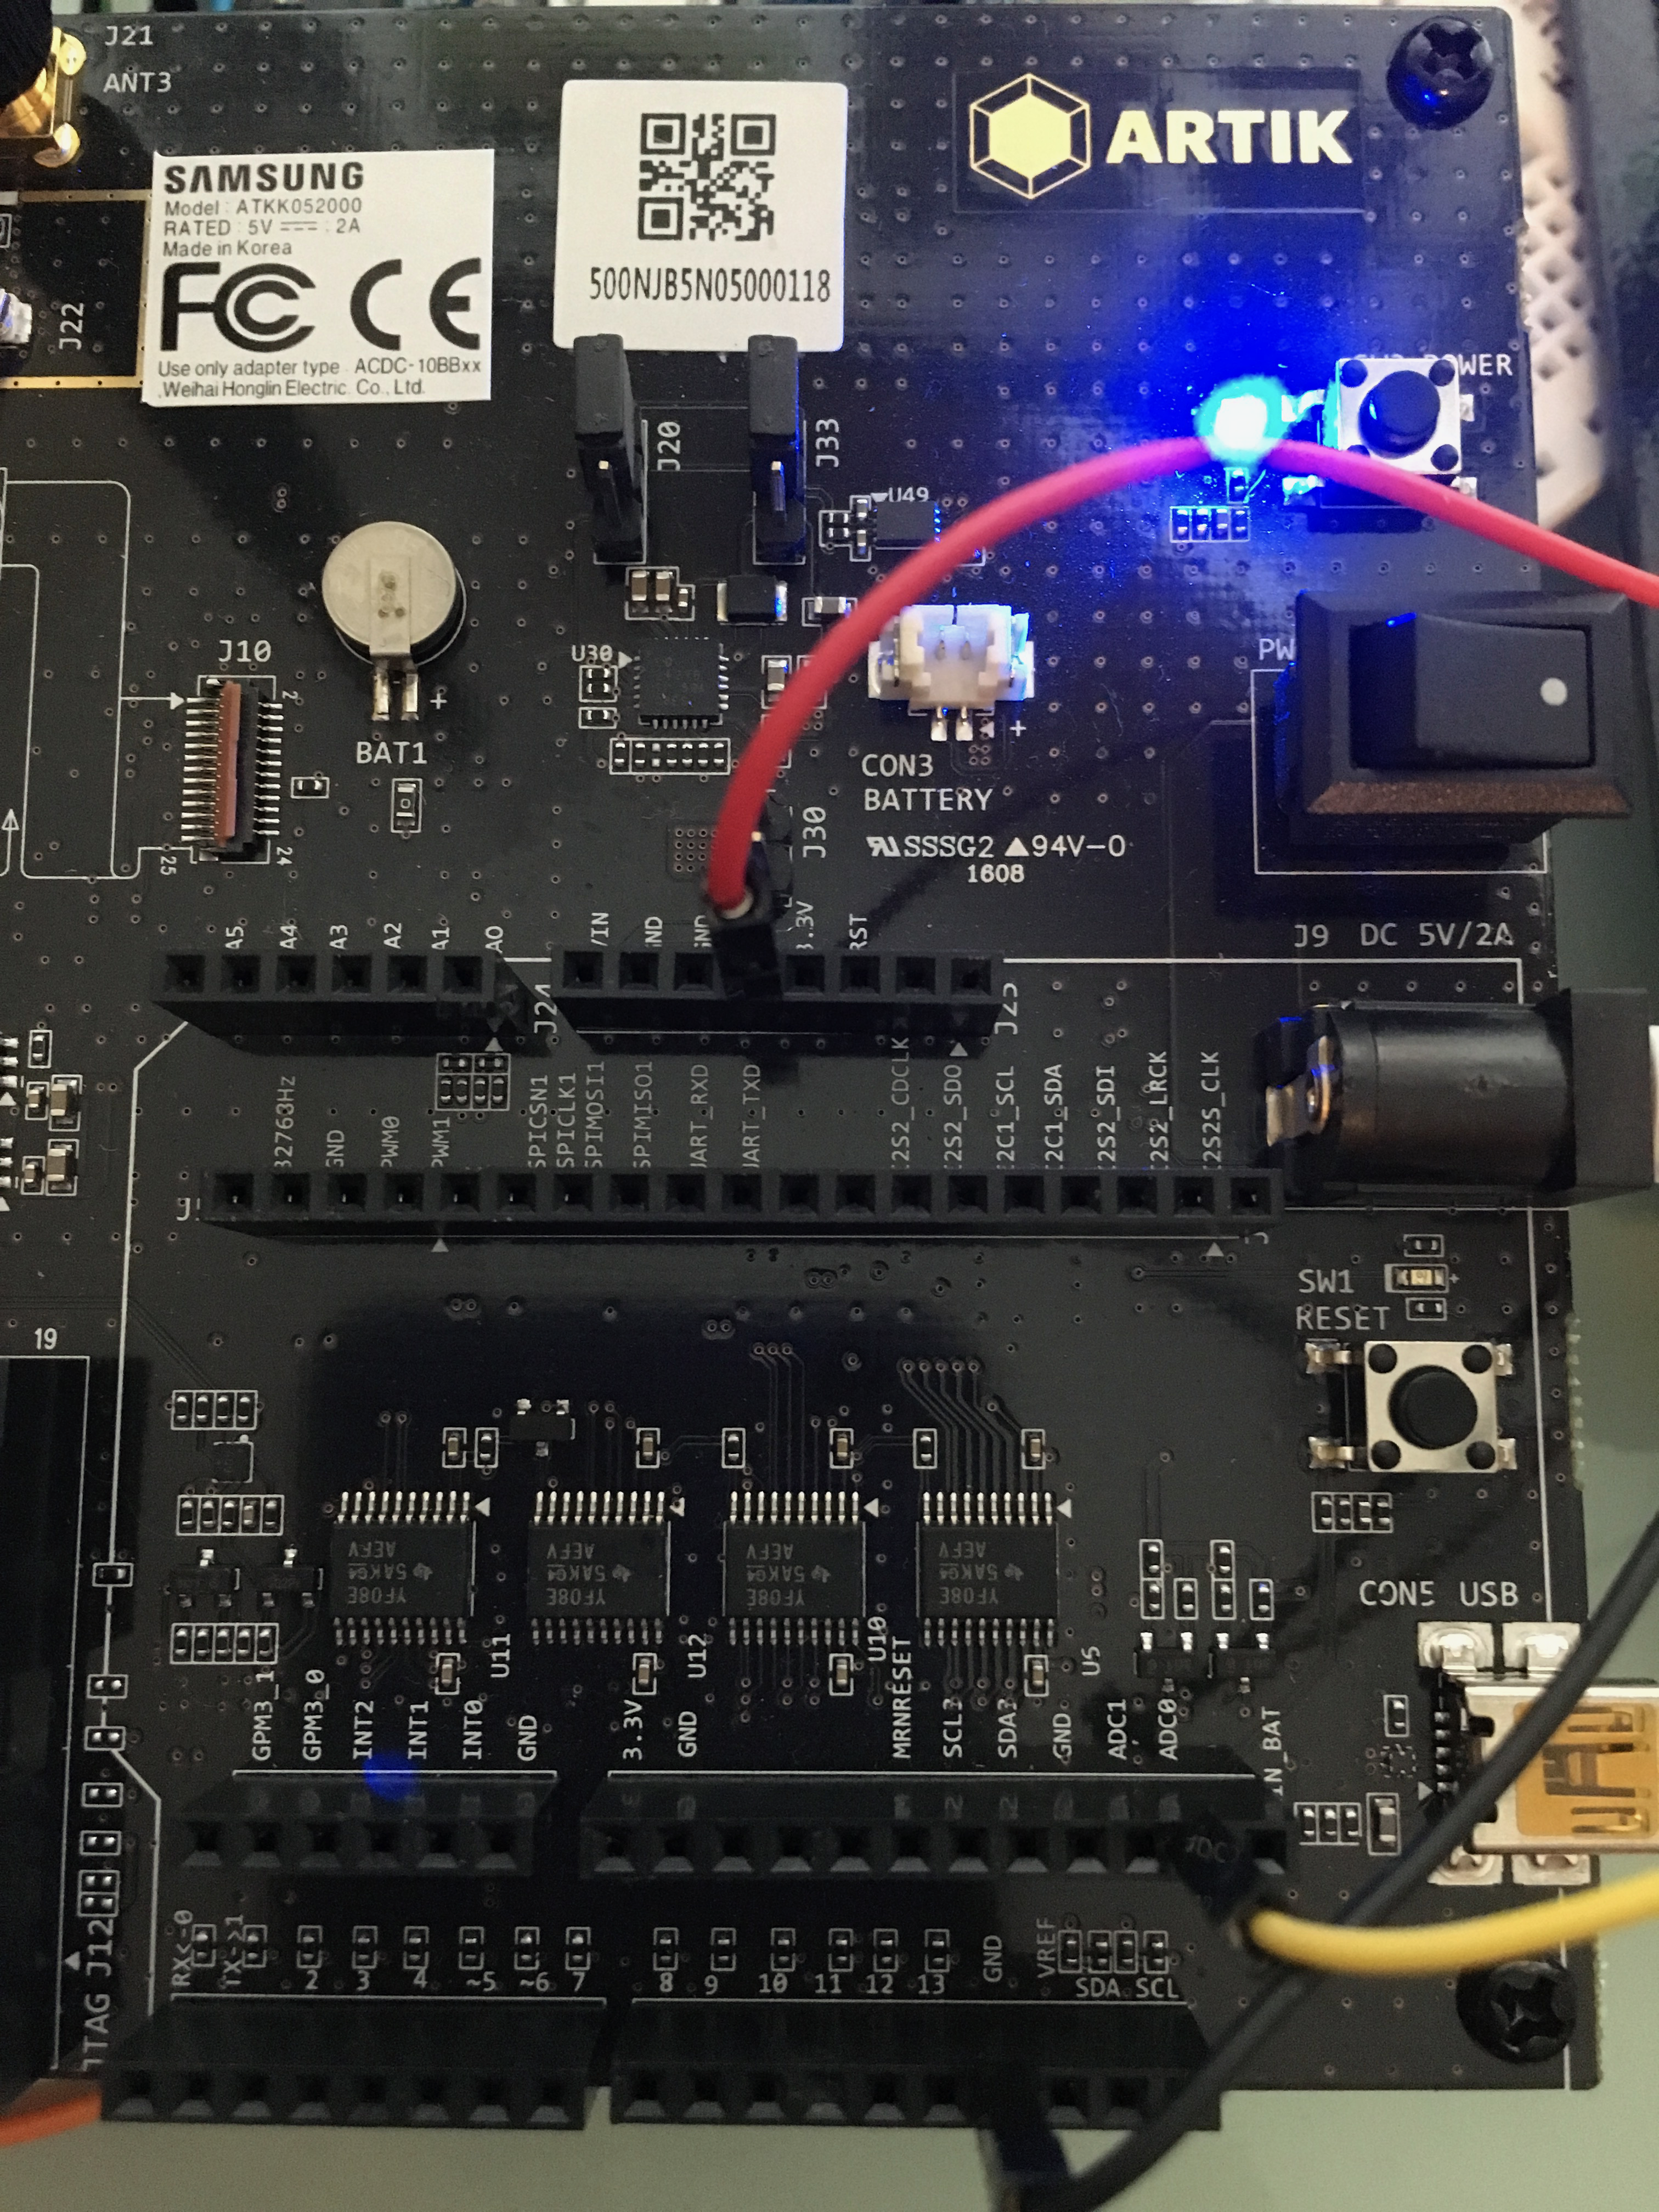
We’re going to use the sensor as a resistive sensor, and the setup is very simple. I’ll be using a breadboard to put this all together for illustrative purposes. First, attach a jumper-wire from 5v on the board to the breadboard.Next, attach a jumper wire from ADC0 on the board to the breadboard. This will be our ADC-in. The sensor should have come with a 560 ohm resistor, so plug that into the board between Vdd and ADC-in holes. Finally, attach a jumper from GND on the board to your breadboard. At this point, your ARTIK 5 should look like this:
And your breadboard should look like this:

Now attach one of the middle 2 leads from the sensor to ground on the breadboad and the other middle lead to the ADC-in on the breadboard. That should complete the sensor hookup and your completed breadboard should look like the above.
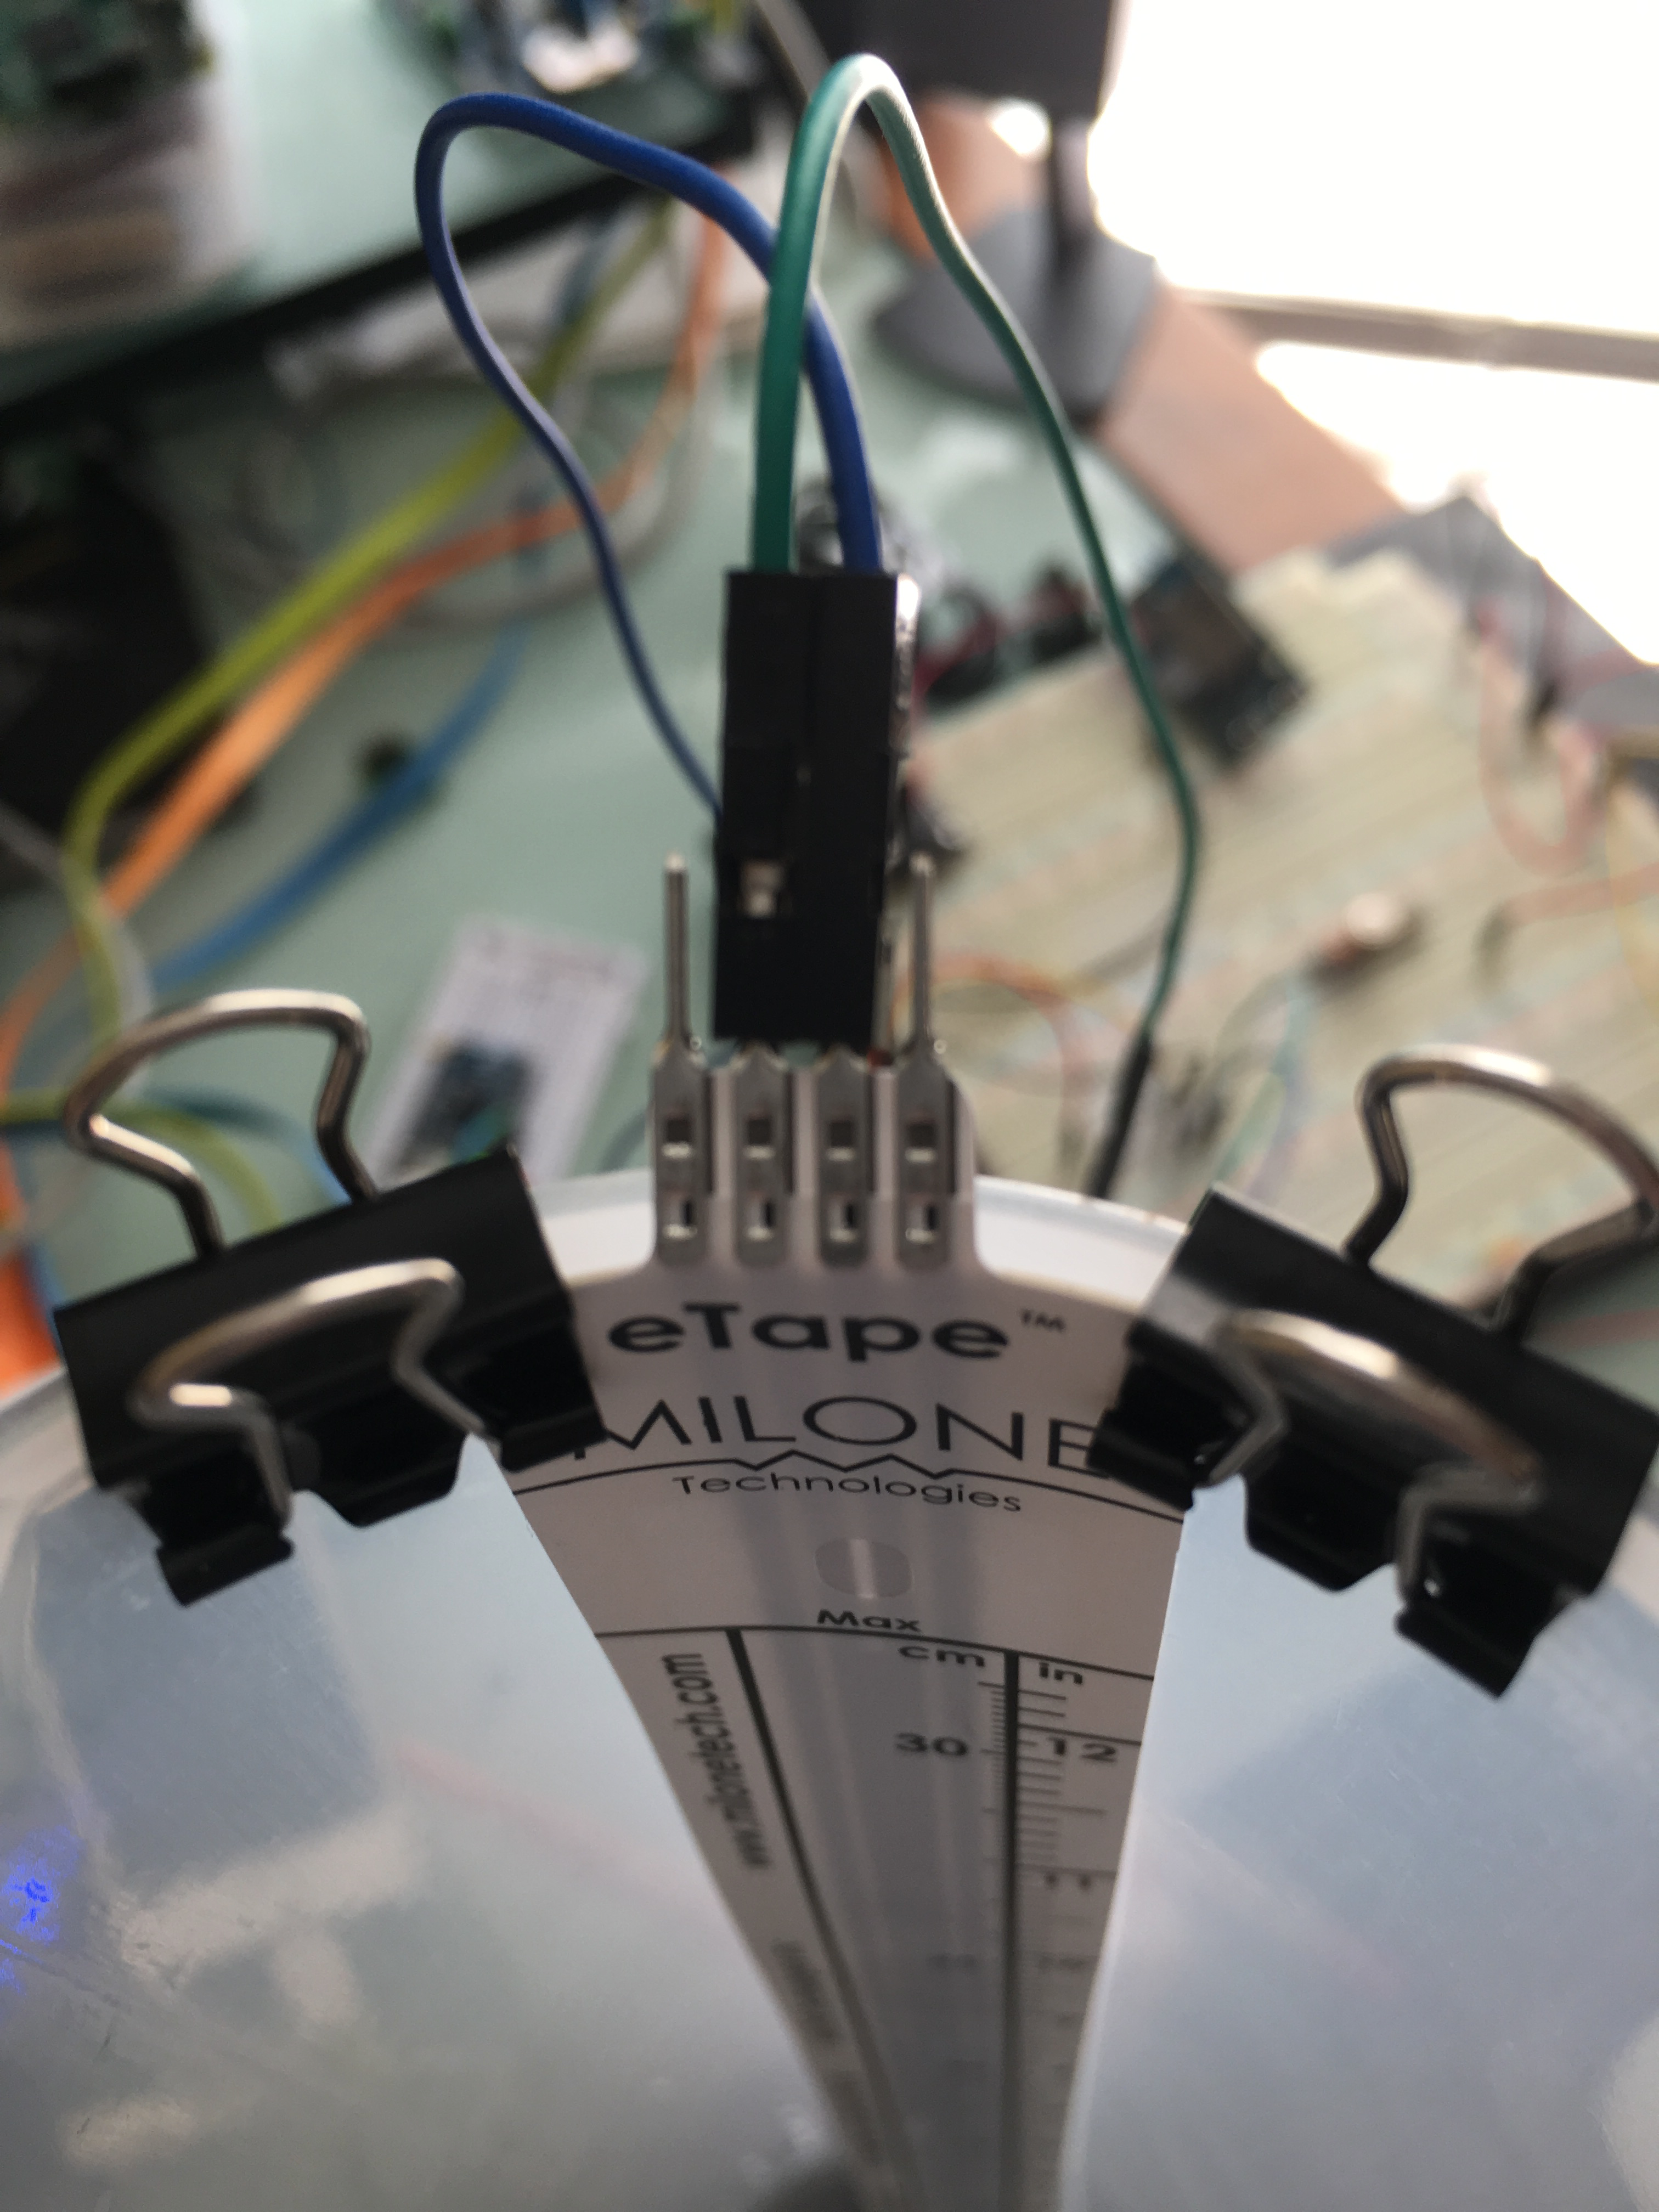
I bought a 1000 ML graduated cylinder in which to put the eTape sensor for testing this project, and here’s what the final hookup of the sensor itself looks like:
Now all I have to do is fill it with water and … oh, wait, I probably have to write some code, huh? Actually, it turns out I have to do surprisingly little of that! I decided to give the Node-Red a spin since I’ve been writing a lot of Node.js code this year anyway. I got my ARTIK-5 up and running using the Resin.io site which was really fast and easy to use. Once that was done, and I had a fully operational ARTIK 5 (Note: don’t use the slim profile, make sure you use the latest profile in your Docker setup. You’ll need it for installing Node-Red), I simply installed Node-Red using
% sudo npm install -g node-red
Once that completed, I installed the ARTIK library for Node-Red
% /root/.node-red
% npm install node-red-contrib-artik
Then, just to make things even easier, I installed the FRED module:
% npm install node-red-contrib-fred
You’ll see why FRED was a good idea in a minute. Once that was all done on the ARTIK 5 I simply started node-red:
% node-red
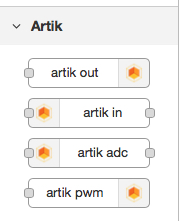
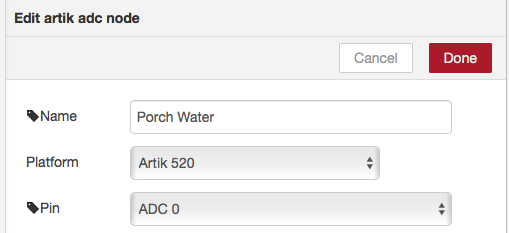
And then connected my browser to the ARTIK-5 Node-Red server and built an app. I dragged in an ARTIK ADC and configured it:
[
a Function
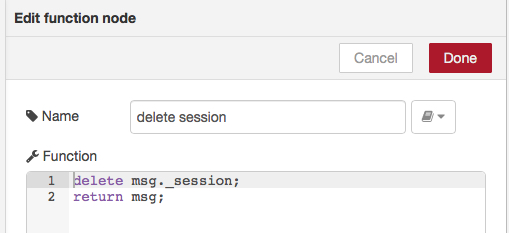
and a JSON module, and then hooked it all up to a FRED-input and a FRED-output:

Oh, and then clicked the ‘Deploy’ button. Told you it was simple.
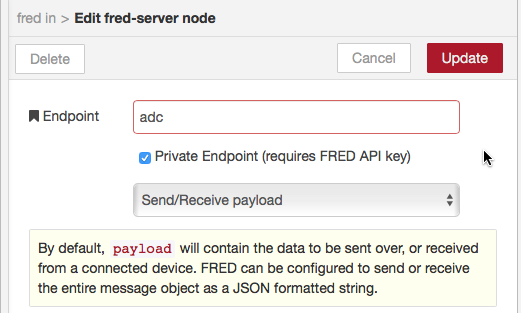
I then went over to my FRED service account at sensitec and logged in. I created a private ADC endpoint:
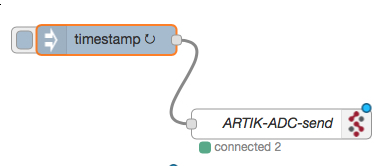
And then added a send ADC event, triggered by a timestamp:
And a receive event that takes the returned data and inserts it into a chart:

Once I started the whole thing, I had a nifty chart showing the water level in my graduated cylinder:

And I wrote essentially zero code.
Next I’ll try installing a MongoDB backend on the ARTIK-5 and sending all the data to that, and then serving that data out to a javascript front-end to chart it all. That will require writing some code, so look for that in the near future!
Also I’ll work on having the actual sensor connected to the ARTIK-0 and sending the data from that to the ARTIK-5 MongoDB instance for collection and analysis. I’m really looking forward to digging in to the ARTIK-0 a bit since that’s more hands-on with C code – something I’ve been neck-deep in lately with MyNewt anyway.
 English
 Deutsche
 Dutch
Dutch Español
 Français