


David G. Simmons
July 14, 2017
Running InfluxDB on an ARTIK-520
Let’s face it, the IoT is about data. I said it just a few weeks ago. It’s about collecting data. Lots of data. But it’s actually about a lot more than just collecting data. Simply collecting data doesn’t really get you anywhere if all you do is collect it. To be useful, IoT data has to be relevant, accurate, and actionable. That last part is the key, really. Actionable data. In order to make your data actionable, you have to be able to analyze it, in real time preferably. Now your data problems are growing. You’ve got a literal tsunami of time-series data pouring in and your spending all your resources just ingesting it. Now I’m telling you that you need to also analyze it, and take actions based on that analysis in real time?! Get out.
Don’t shoot the messenger. You’re the one that wanted to deploy an IoT solution to monitor all 10,000 of your whosiwhatsits, not me. But I’m going to tell you how to solve it.
Not the ARTIK-520 Again!
Yes, the ARTIK-520 again. I had a Linux server here in the office that would probably have been a nice place to do this, but it’s gone to its home now (I was only fostering it and making it useful before shipping it off to live a long and productive life as an Active Directory Server. Don’t ask. We will never speak of it again). I could have used a Raspberry Pi, or even the Raspberry Pi Zero W that I have sitting here. As you know, I have a plethora of IoT Devices from which to choose. I wanted something with a little more horsepower than a standard IoT device and I just didn’t feel like futzing with the Pis. So you’re stuck hearing about the 520 again.
Setting up for Data Ingestion and Analysis
Wait, we’re going to do data ingestion and analysis on an ARTIK-520? Shouldn’t we be using a server? See above. Plus, wouldn’t it be slightly interesting to do some data ingestion and analysis at the hub, before the data is sent on to the backend? Maybe. So that’s what we’re going to do.
As the title of this post suggests, we’re going to use InfluxDB from Influx Data. It’s open source, and free if you want to try it out too. Feel free to follow along. Why InfluxDB? Well, I wanted to try it out, and it claims to be the fastest growing Time Series database around, plus I heard it was pretty easy to get up and running so I thought I’d give it a go.
First, I’ll say that getting it all up and running was absolutely dead simple. Like your VP of Marketing can do it (Inside Joke Alert: Back in my Sun days, building demos that were installable and runnable by my Marketing VP was always my metric. He loved it because he could run them!) I downloaded all the components and started them up. There are a bunch of moving parts here, so you need to make sure to get them all. There’s InfluxDB, which is (obviously) the database portion. Sort of key to the whole thing. There’s also Telegraf, which is a data ingestion engine. Then there’s Chronograf, which is a really nifty visualization and analysis tool. Finally there’s Kapacitor which handles the whole “Action” part for you.
I was able to download and install all the parts in about 5 minutes – maybe less – and get the whole thing up and running. I even built my first dashboard to monitor the CPU and Memory usage of the ARTIK-520 in about a minute and a half.
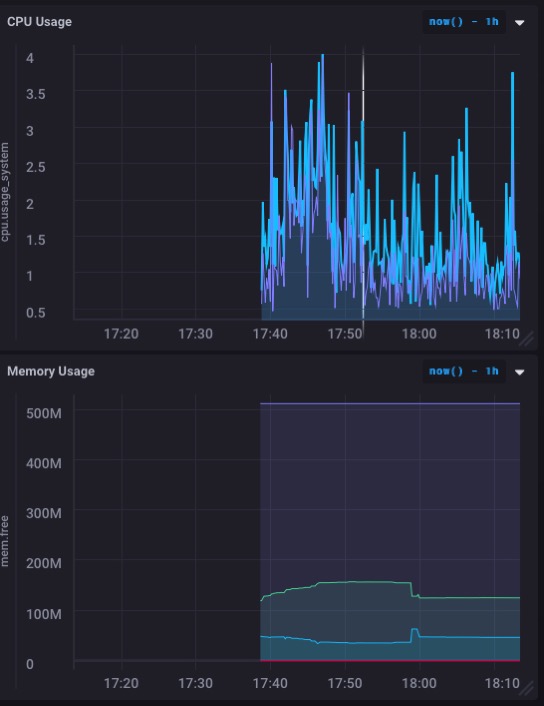
Which actually looks really good. Especially the memory usage graph. So I probably won’t overwhelm the memory with this – and let’s keep in mind that I’m still running this ARTIK-520 as an OpenHAB server controlling my house.
But I really want to use this for monitoring some actual sensor data, not just the machine itself. It just so happens that I have a sensor project here on my desk, and it is actively collecting data and logging it. Logging it elsewhere, but that’s about to change.
Logging Live Data
The sensor I have already set up and running is a one I wrote about recently. It’s hooked to a Particle.io Photon and is measuring the amount of ‘stuff’ in a box pretty much continuously (1 reading every second). I created a database for this – ‘iotdata’ aren’t I original? – and tested posting to it from the command line as per the (excellent) documentation. Everything seemed to go as planned. Now to get live data streaming in!
First I had to poke a hole in my firewall to be able to get to to my ARTIK-520 box from the outside world. It seems crazy that the Particle is on one side of my desk and the ARTIK-520 is on the other and my data has to make a trip around the planet to get there, but that’s how the world works sometimes.
Particle has ‘Webhooks’ that you can set up to post to other services. They have some pre-defined ones for Google Apps, etc. but none for InfluxDB. They need to fix that, but that’s another post. I tried to define my own Webhook, but their web hooks insist on posting everything as
content-type: application/x-www-form-urlencoded
And that’s not what is expected, and it turns out not to work. Not to be deterred, I managed to come up with another solution. The Particle device will post its data directly to InlfuxDB. Who needs a middleman! It takes slightly more code, but it’s not bad. Here’s what I had to add to my Particle code:
#include <HttpClient.h>
...
HttpClient http;
http_header_t headers[] = {
  { "Accept" , "*/*"},
  { "User-agent", "Particle HttpClient"},
  { NULL, NULL } // NOTE: Always terminate headers will NULL
};
http_request_t request;
http_response_t response;
...
void loop(){
...
  request.body = String::format("volume_reading value=%d", getRangeReading());
  http.post(request, response, headers);
...
}
That’s all it took! You’ll notice that I’m not using any security on this setup. I do not recommend doing it this way. At the very least you should be using a username/password for authentication to the database, and you should probably also being using SSL. But I don’t have an SSL cert for my ARTIK-520, and this was just an exercise on my part and not a real deployment. Plus I poked non-standard holes in my firewall, and don’t really think that anyone’s going to come knocking (and if they do, I’ll see it instantly and can shut them out, so don’t get any ideas).
And here’s what my dashboard now looks like:
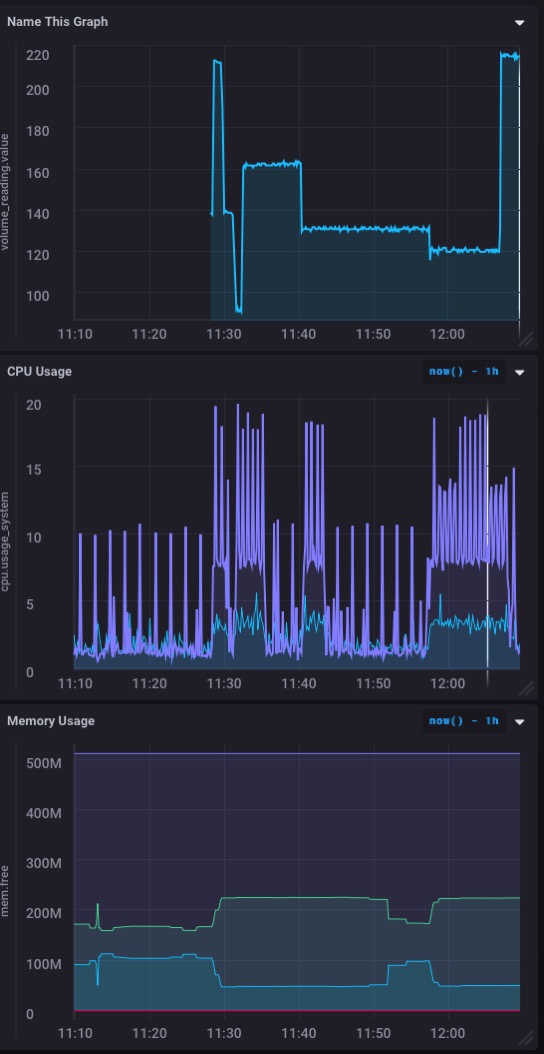
A nice real time graph of the incoming data from my sensor. Fast and easy to set up!
Make It Actionable
So far, we’ve set up Telegraf for data ingestion, InfluxDB, the actual database, and Chronograf which gives us the cool dashboards of real-time data from our sensor(s). But again, data is all cute and fun but it’s the making it actionable that is key. And that’s where Kapacitor comes in. So I’m going to set that up next so that I can get alerts and notifications when the volume of ‘stuff’ in my box gets too high, or too low.
Kapacitor, sadly, doesn’t have a slick UI front end that lends itself easily to seeing your results in a visually satisfying way. But it’s no less powerful. You just have to write your ‘actions’ in TICKScript and then deploy them. So dive into the documentation and get going already!
The syntax for TICK Scripts is a bit fiddly, so really do make sure that you’ve read the documentation on this one. Seriously. I was able, in about 10 minutes, to write 2 TICK Scripts to alert when the volume measurement got below 50 (which is pretty darned full!) or when it got above 210 (which is essentially empty). For now, those alerts are simply logged to a file, but I could just as easily turned them around as a POST to my server to do a browser alert or something else.
I’d love to see a fancy front-end on Kapacitor that makes writing and deploying TICK Scripts quick and easy, and that allows you do to alerts and things on your Chronograf Dashboards, but for now I’m pretty happy with just sending alerts off to other things.
If I wanted to, I could send those alerts back to my Photon – via a POST to the Particle Cloud API – to have the Photon take an action of its own as well. Maybe if I had a pneumatic ‘pusher’ that would shove everything out of the box I’d do just that.
Your Turn
Hopefully I’ve gotten you far enough down the road that you can start your own InfluxDB based project for your IoT data. If you do, I’d love to hear about it!
 English
 Deutsche
 Dutch
Dutch Español
 Français