


David G. Simmons
December 18, 2017
Monitoring OpenWRT with Telegraf
This post was originally published on InfluxData’s blog.
What’s the most popular open source router software in the world? OpenWRT, of course! It’s the go-to firmware replacement for a huge number of routers both for home and business use. So of course, you need to monitor it! Now routers are, strictly speaking, an IoT device, but hey, it is a (relatively) small, embedded device that is ubiquitous, and really deserves some attention. As it turns out, monitoring your WRT-enabled router with InfluxDB is so simple it’s scary!
Built-In Monitoring
OpenWRT does have some basic built-in monitoring that you can look at, but it’s only available on the web page served by the router, it’s not, as far as I can tell, able to be aggregated across multiple devices, and it is, as I said, pretty basic.
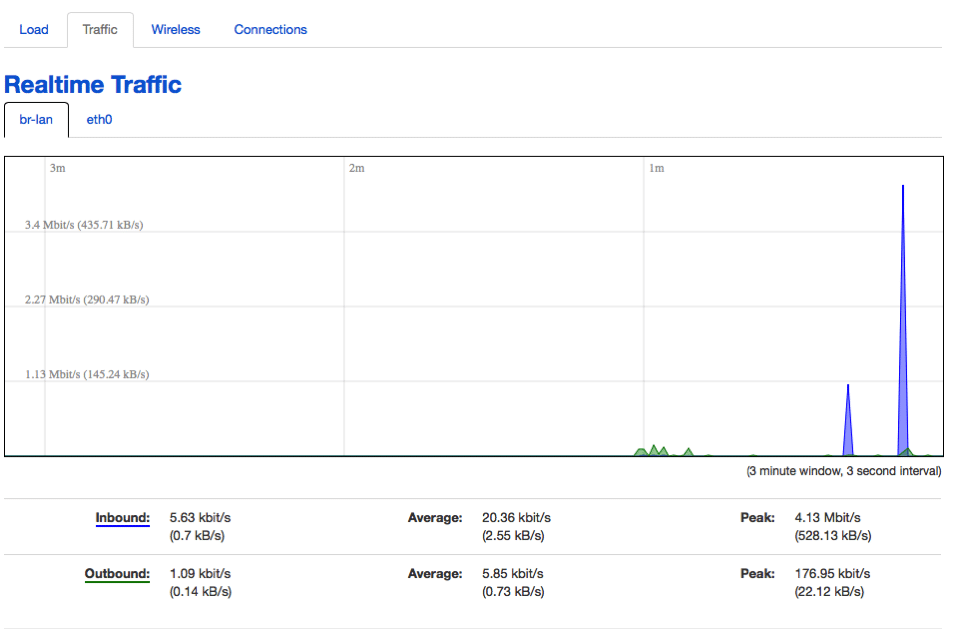
If you’ve played around with Chronograf at all, you’ll think that’s very rudimentary at best. So let’s enable some more detailed monitoring!
More Detailed Monitoring
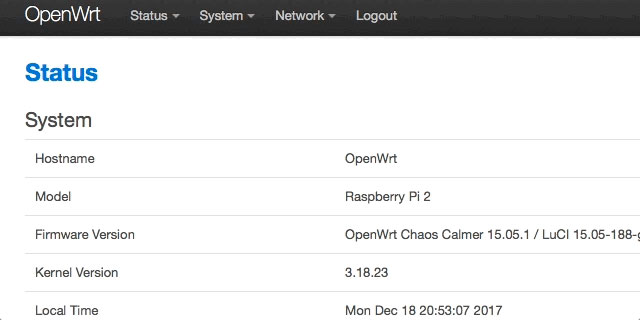
To start with, I don’t happen to have an old Linksys router lying around, so I built this all on a Raspberry Pi, but the concept is the same, and you can do the exact same thing on any WRT-supported router with little to no difficulty.
Really all you have to do is burn the WRT Image to a microSD card, insert that into your Raspberry Pi, and turn it on! Your Pi is now a router! The next step is to get part (or all, if you have room) of the TICK Stack installed on your new router. I’m running my Raspberry Pi on an 8GB microSD, so the space on my device is severely limited. That being the case, I decided that I’d install only Telegraf, and have it send all its data to an InfluxDB server somewhere else. So head over to the Downloads Page and get the ARM version of Telegraf. It’s a gzip-compressed tar file, which is actually good in this case. Once you have it on your local machine, you’ll need to use scp to copy it over to your router:
davidgs$ scp telegraf-1.5.0_linux_armhf.tar.gz root@192.168.2.3:telegraf-1.5.0_linux_armhf.tar.gzCopy
Once you’ve done that, ssh into your router and unpack/install Telegraf:
root@OpenWrt:~# tar xzvf telegraf-1.5.0_linux_armhf.tar.gz
root@OpenWrt:~# mv telegraf/usr//bin/telegraf /usr/bin
root@OpenWrt:~# mv telegraf/usr/lib/telegraf /usr/lib
root@OpenWrt:~# mv telegraf/var//log/* /var/log
root@OpenWrt:~# mv telegraf/etc/* /etcCopy
Then it’s a simple matter of pointing Telegraf at your InfluxDB instance by editing the telegraf.conf file:
[[outputs.influxdb]]
 ## The full HTTP or UDP URL for your InfluxDB instance.
 ##
 ## Multiple urls can be specified as part of the same cluster,
 ## this means that only ONE of the urls will be written to each interval.
 # urls = ["udp://127.0.0.1:8089"] # UDP endpoint example
 urls = ["http://192.168.2.1:8086"] # requiredCopy
Of course, your URL will be different, but you get the idea. Then, you’ll want to load the admin page from your router and select the System>Startup page
Then just add the command to start Telegraf:
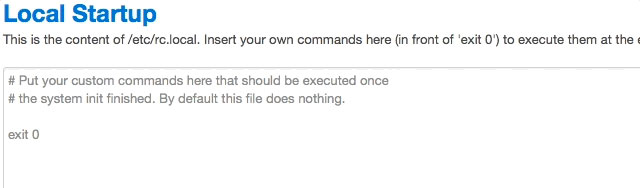
Now any time your router is reset, Telegraf will automatically restart and continue sending your router’s stats up to InfluxDB.
Finally, I went into my local InfluxDB instance and built a Dashboard to monitor the router:
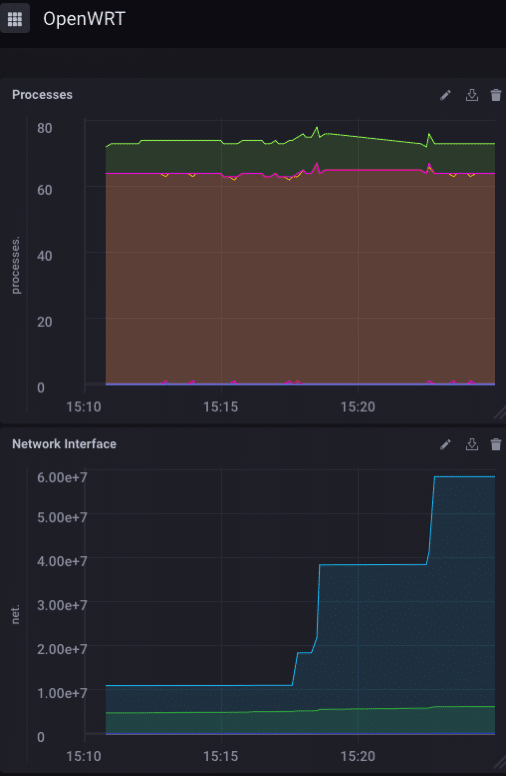
Again, if I were deploying multiple WRT routersa common thing with many enterprisesI’d set them up to all report to the same InfluxDB instance, and build myself a dashboard where I could monitor all the routers in my company from a single pane of glass.
Going Further
Now it’s your turn! If you have an old router lying around, why don’t you build your own self-monitoring router! If you have room, install InfluxDB and Kapacitor on it as well and build some alerts to let you know when things go wrong with your router. Or build dashboards that run right on the router itself!
 English
 Deutsche
 Dutch
Dutch Español
 Français