
David G. Simmons
Friday, March 22, 2019
Using Cross-Measurement math in InfluxDB Flux
I’ve been spending a lot of time lately with the 2.0 Alpha releases and I’m here to tell you: some of the new things coming are really, really cool! Especially for IoT. The one I’ve been using lately has been the ability to do math across measurements, which is really a game-changer for IoT data in InfluxDB.
Let’s look at why here for a minute. As you probably know, I’ve been building out a bunch of IoT sensors that stream data to various instances of InfluxDB. One of the main sensors I use is a SenseAir K-30 CO2 sensor. It’s a fabulously accurate sensor, though it’s not cheap. I’ve been using it for a year or so and it’s extremely reliable and accurate, but I was wondering about how the temperature and the pressure might affect the CO2 readings. What I found was, of course, these things do, in fact, matter.
I read up on it here, but essentially the temperature and atmospheric pressure affect the amount of gas inside the measuring chamber, not the concentration, so one should compensate for that. It’s a fairly simple calculation to do using some reference values like absolute zero and the pressure at sea level.
We’ll use the Ideal Gas Law formula:
ppm CO2 corrected = ppm CO2 measured * ((Temp measured * Pressure Reference ) / (Pressure measured * Temp Reference))
Great. Easy! Almost. I have a temperature/pressure sensor that stores values in an ‘environment’ measurement in my InfluxDB instance. My CO2 sensor stores its readings in a “k30_reader” measurement. If you’re not using Flux, you already see the problem here: These values live in different measurements, so I either can’t do this calculation or I have to do a fair amount of gymnastics to somehow rewrite all these values into a common measurement first. Neither is a really viable answer, is it?
Enter Flux and cross-measurement maths! So let’s walk through how I accomplished this in Flux (with a ton of help from fellow DevRel Anais, among others). A little refresher on how Flux returns values first. Let’s remember that when I submit a query in Flux, I get back a table of values. This becomes important as we walk through how the Flux query is built, so keep that in mind.
Tref = 298.15
Pref = 1013.25

Tmeas = from(bucket: "telegraf")
   |> range(start: v.timeRangeStart)
   |> filter(fn: (r) => r._measurement == "environment" and (r._field == "temp_c"))
   |> fill(column: "_value", usePrevious: true)
   |> aggregateWindow(every: 30s, fn: mean)
   |> keep(columns: ["_value", "_time"])
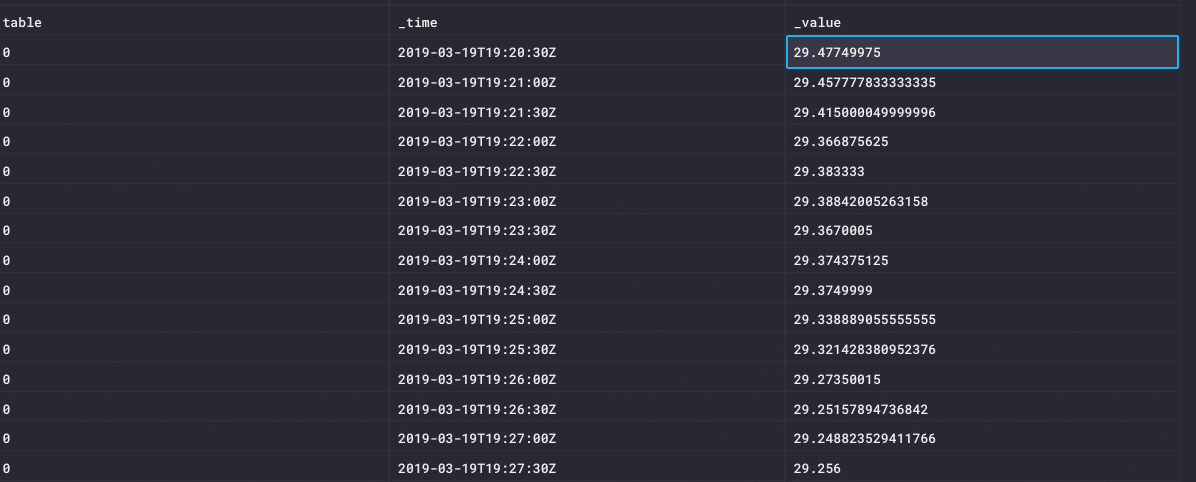
First I’ve defined my reference temperature and pressure values. The reference temperature is usually 25ºC, converted to Kelvin, and the reference Pressure is sea level. I then query values of the Measured Temperature Values and store it in a table called ‘Tmeas’. If I yield() on this table, I’ll see my temperature values:
I then repeat this for the CO2 and Pressure values:
CO2meas = from(bucket: "telegraf")
   |> range(start: v.timeRangeStart)
   |> filter(fn: (r) => r._measurement == "k30_reader" and (r._field == "co2"))
   |> fill(column: "_value", usePrevious: true)
   |> aggregateWindow(every: 30s, fn: mean)
   |> keep(columns: ["_value", "_time"])
Pmeas = from(bucket: "telegraf")
   |> range(start: v.timeRangeStart)
   |> filter(fn: (r) => r._measurement == "environment" and (r._field == "pressure"))
   |> fill(column: "_value", usePrevious: true)
   |> aggregateWindow(every: 30s, fn: mean)
   |> keep(columns: ["_value", "_time"])
Great! I now have 3 tables with all the values I need to do my calculations. All I have to do now is pull them all together, and I’ll do that through a series of join() statements:
first_join = join(tables: {CO2meas: CO2meas, Tmeas: Tmeas}, on: ["_time"])
    |> fill(column: "_value_CO2meas", usePrevious: true)
   |>fill(column: "_value_CO2meas", value: 400.00)
    |> fill(column: "_value_Tmeas",usePrevious: true)
   |>fill(column: "_value_Tmeas", value: 20.0)
This first join() gets me a table that contains the CO2 and temperature values, so I’m part way there.
second_join = join(tables: {first_join: first_join, Pmeas: Pmeas}, on: ["_time"])
   |>fill(column: "_value", usePrevious: true)
   |>fill(column: "_value", value: 1013.25)
   |>map(fn: (r) => ({_time: r._time, _Pmeas: r._value, _CO2meas:r._value_CO2meas, _Tmeas:r._value_Tmeas}))
This second join() gets me a table with all the measured values in it! You’d think I’d be done, but in order to do the final calculation, since I’m joining on time, I have to build a final table where I fill in the reference values for each row in the table.
final = second_join
   |>map(fn: (r) => ({Pmeas: r._Pmeas, CO2meas:r._CO2meas, Tmeas:r._Tmeas, Pref: Pref, Tref: Tref, _time: r._time,}))
    |> keep(columns: ["_time", "CO2meas", "Pmeas", "Tmeas", "Pref", "Tref"])
So now I can create a final table and calculate the compensated CO2 value, for each row (time).
CO2corr = final
    |> map(fn: (r) => ({"_time": r._time, "CO2-Measured": r.CO2meas, "CO2-Adjusted": r.CO2meas * (((r.Tmeas + 273.15) * r.Pref) / (r.Pmeas * r.Tref))}))
   |> yield()
Since this is my final table, I call yield() at the end so that the values will get displayed.
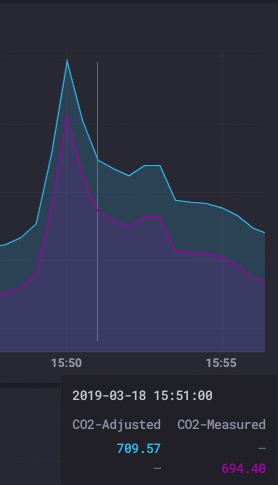
And now I have a graph that shows the raw, measured CO2 value and the compensated CO2 value! All done on-the-fly using Flux’s cross-measurement math!
I’ve actually been wanting to do this sensor compensation for a long time and I’m thrilled that I can now do it quickly and easily using Flux! So what will you do with cross-measurement math in Flux? Feel free to tweet me your ideas, solutions, etc. @davidgsIoT!